Track what matters
Choose the field that represents the outcome your team cares about.
Phase-level performance tracking
See how every workflow phase contributes to the goal. Track key fields across pipeline phases with automated calculations and visual insights that reveal bottlenecks, opportunities, and performance trends.
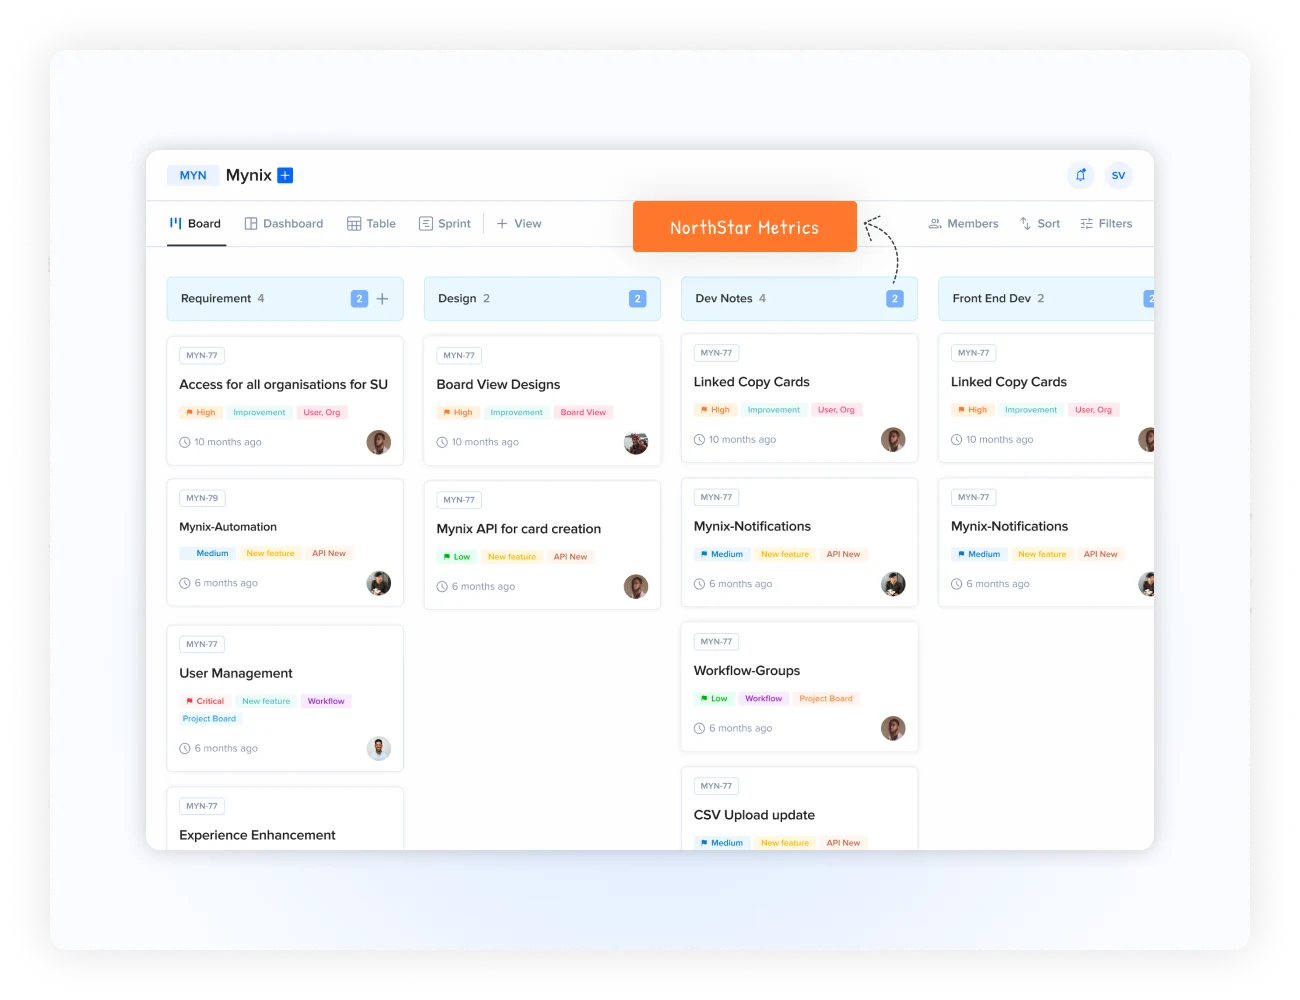
North Star Metrics at a glance
Apply functions to tracked fields such as revenue, cost, or margin and see the result across every stage.
Choose the field that represents the outcome your team cares about.
Use mathematical functions to summarize the work at every stage.
See where value builds, slows down, or drops between phases.
Use clear signals to focus improvement where it can have impact.
Read the pipeline clearly
A North Star view turns scattered field values into a phase-by-phase readout for faster decisions.
SUM across phases
18 opportunities
11 opportunities
5 opportunities
Total deal value currently moving through the workflow — read as a single number, broken down by phase.
Metric tracking examples
North Star Metrics works with the fields already inside your workflow. Follow revenue through sales or understand costs through delivery.
Field: Deal Value · Function: SUM · Goal: Pipeline value
Field: Project Cost · Function: AVERAGE · Goal: Spend per phase
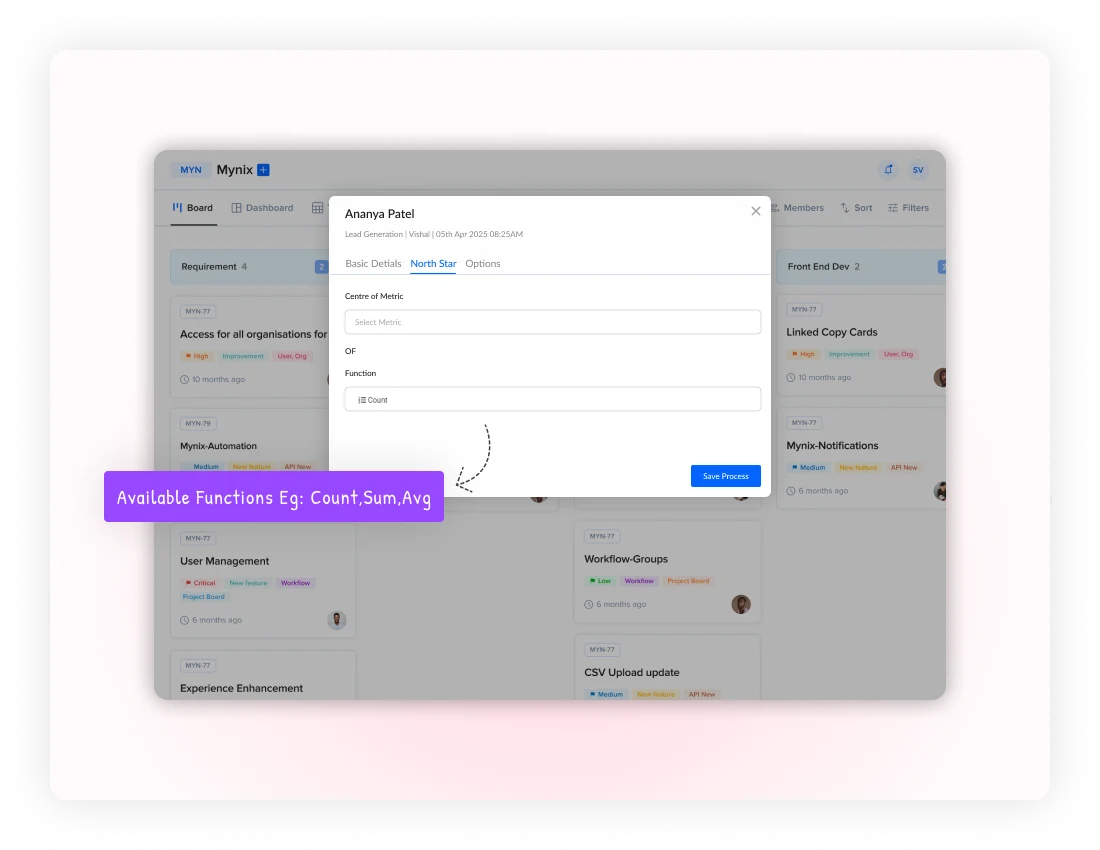
Available functions
Switch between summary functions to understand totals, averages, volume, and range within each phase.
How it works
Configure the field, function, and display, then follow performance as items move between phases.
Choose revenue, cost, margin, or another tracked field.
Apply SUM, AVERAGE, COUNT, MAX, or MIN.
Set the visual display and phase comparison options.
See calculations update as items move between phases.
Identify phases that perform well or need attention.
Use the insight to improve efficiency and outcomes.
Performance insights
North Star metrics turn phase activity into signals your team can use to focus the next improvement.
Compare the contribution of each phase to the overall objective.
Spot slowdowns before they become persistent bottlenecks.
Understand the relationship between effort, cost, and outcome.
Give teams a clear signal for the next process improvement.
Perfect for teams that manage phases
Three teams that benefit from a phase-by-phase read on the numbers that matter.
Track deal values, conversion rates, and revenue potential across sales phases.
Tracked metrics: Total pipeline value, average deal size, conversion rates, and time in phase.
Monitor project costs, budget utilization, and resource allocation across delivery.
Tracked metrics: Phase costs, resource utilization, budget versus actual, and completion rates.
Analyze resolution time, satisfaction, and workload distribution by stage.
Tracked metrics: Resolution time, satisfaction scores, workload by priority, and escalations.
Track a meaningful field, compare its performance across the workflow, and use the signal to improve what happens next.