Workflow Analytics
4 widgets for phase distribution, progress, and bottleneck discovery.
Dashboard & analytics
Turn workflow data into useful business insights without building dashboards from scratch. Add a ready-to-use widget, connect it to your workflow, and start analysing immediately.
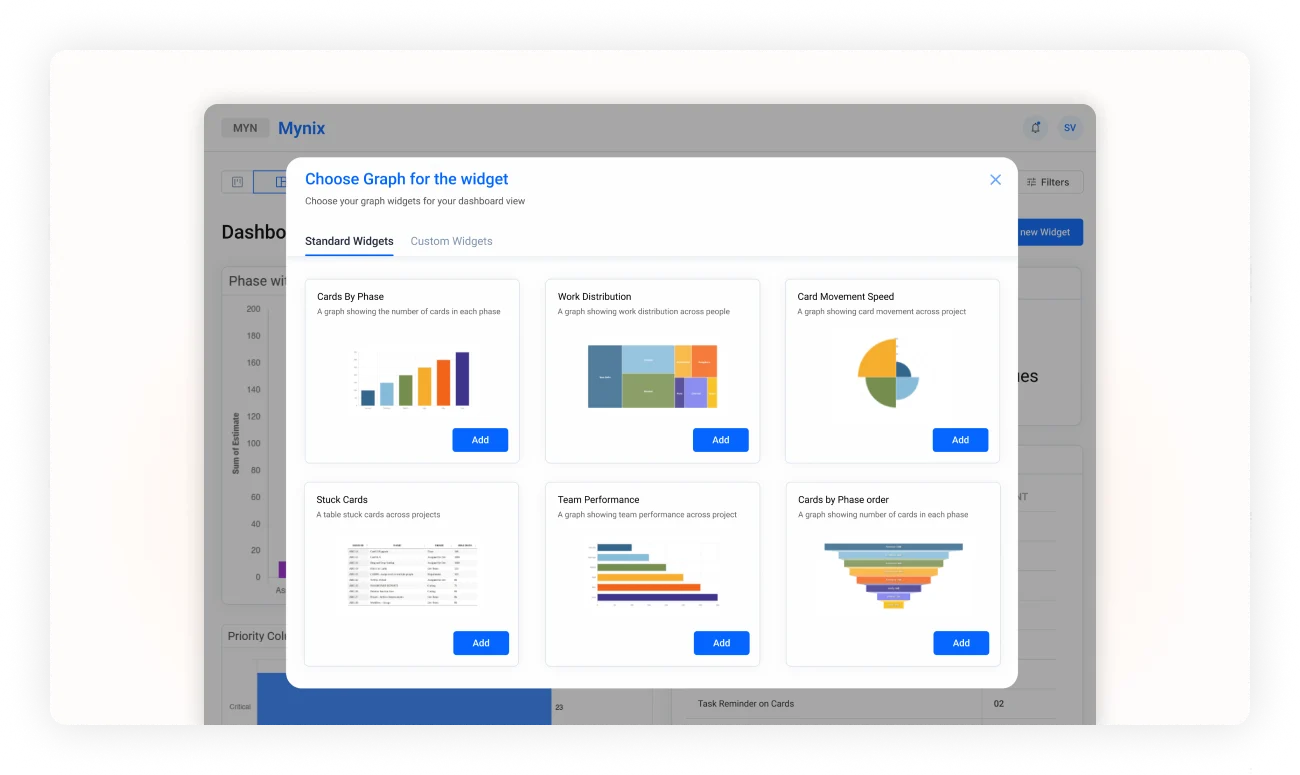
Ready-to-use analytics
Standard widgets are pre-configured analytics components. They pull from existing workflow data and present the result in the format that makes the question easiest to answer.
No dashboard configuration required.
Insights reflect the latest activity.
Pre-built views for common questions.
Workflow, team, time, and summary analytics.
12 widgets · 4 categories
Browse the category that matches the decision in front of you, then add the visualization that makes the answer clear.
4 widgets for phase distribution, progress, and bottleneck discovery.
3 widgets for workload distribution, completion, and efficiency.
3 widgets for cycle time, SLA compliance, and throughput.
2 widgets for fast counters and structured metric review.
The complete library
See the workflow in context
Workflow Analytics surfaces where work is located and where it slows down. Pair Cards By Phase with Bottleneck Analysis to see both the volume and the delay behind it.
Distribution shows the shape of the work. Time and productivity widgets explain how that shape affects delivery.

Why teams use standard widgets
Skip dashboard-building overhead and give every team a reliable starting point for operational decisions.
No technical skills or training are needed to add a useful view.
Spot bottlenecks, overdue work, and uneven workload distribution.
Use current workflow information to understand completion and throughput.
Bring live operational evidence into everyday team conversations.
Built for every operating team
Track project progress, workload, workflow distribution, and delivery timelines.
Monitor ticket volume, resolution times, workload, and SLA compliance.
Follow lead progression, candidate stages, interview activity, and cycle performance.
Measure process efficiency, quality, approvals, invoice work, and compliance.
Choose from 12 ready-to-use widgets and turn Mynix workflow data into actionable insight from day one.