Free movement
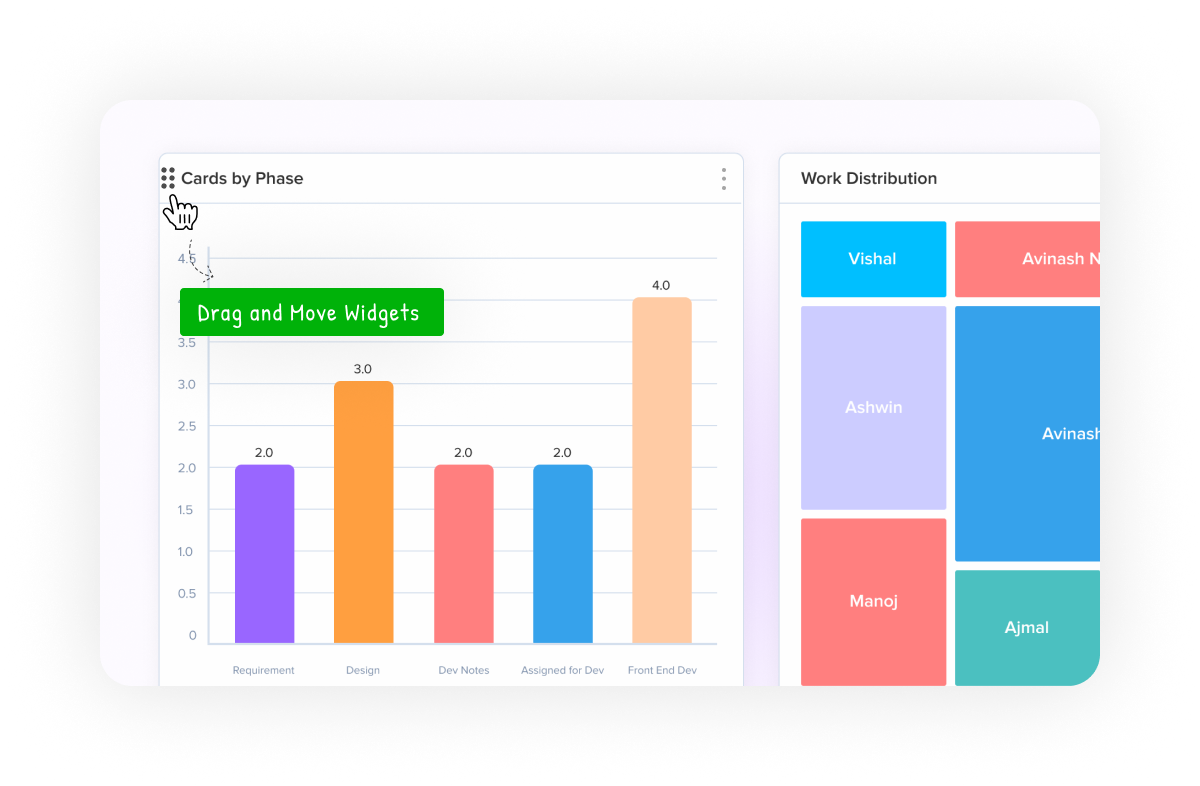
Move widgets anywhere within the available dashboard canvas.
Dashboard & analytics
Create personalized analytical views by organizing widgets into layouts that match the way your team works. Combine standard and custom widgets, resize and reposition them, apply dashboard-wide filters, and build focused views for every role.

Your analytics command center
Custom Dashboards are personalized analytical workspaces where you decide what appears, where it appears, and how it is organized. Create a focused command center for a business area, project, team, or role.
Create as many dashboards as your organisation requires, each with its own purpose and audience.
Arrange widgets into the configuration that fits your analytical workflow.
Create separate dashboards for teams, departments, roles, or responsibilities.
Bring standard and custom widgets into one centralized view.
Scale focused workspaces as your organisation and reporting needs grow.
Create a dashboard your way
Build the dashboard from scratch or use a template, then add and shape the widgets around the decisions your team makes.
Start with a blank dashboard or select a pre-built template.
Drag Standard Widgets and Custom Widgets from the sidebar to the canvas.
Move and resize widgets to create the view you want.
Set dashboard-level filters to focus the data across every widget.
Build the canvas around the work
The dashboard canvas gives teams direct control over widget placement. Add the right widgets, position them around priority, and keep the structure readable as the view grows.
Control the dashboard surface
A counter may need a small footprint. A detailed table or trend chart may need room to breathe.
Move widgets anywhere within the available dashboard canvas.
Keep widgets aligned while you shape the analytical layout.
Choose Small, Medium, or Large for quick sizing adjustments.
Adjust width or height independently for precise control.
Resize the overall widget area to fit the information inside.
Maintain proportions when the visual needs a balanced shape.
Dashboard-level filtering
Apply one shared context across the dashboard instead of configuring every widget separately.
Start faster with templates
Pre-built dashboards give teams a structured starting point for common business scenarios.
Key counters, trend analysis, comparisons, and high-level summaries for leadership.
Work distribution, individual performance, completion rates, and workload balance.
Phase distribution, progress tracking, bottlenecks, and timeline adherence.
Ticket trends, resolution time, SLA compliance, and agent performance.
Share and manage with intention
Give specific team members access to the dashboards relevant to their work.
Offer view-only access or allow selected collaborators to edit layouts and configuration.
Generate shareable links for controlled external viewing and client reporting.
Use folders, favorites, tags, and duplication to keep unlimited dashboards easy to find.
Built for every analytical scenario
Role-specific metrics and KPIs across a department.
Customized views across projects and delivery timelines.
Complex arrangements and advanced filtering for investigation.
Live monitoring for performance and emerging issues.
Build your analytics command center
Create the dashboard, add your widgets, arrange the layout, apply global filters, and share the right view.
Begin with a template or blank dashboard.
Combine Standard and Custom Widgets.
Position, resize, and prioritize the canvas.
Apply filters, permissions, and sharing controls.
Start with a template or blank canvas, bring your data together, and create the analytical workspace your team needs.