Bar Chart
Comparisons and rankings. Use horizontal bars for team performance, department workload, and project status distribution.
Dashboard & analytics
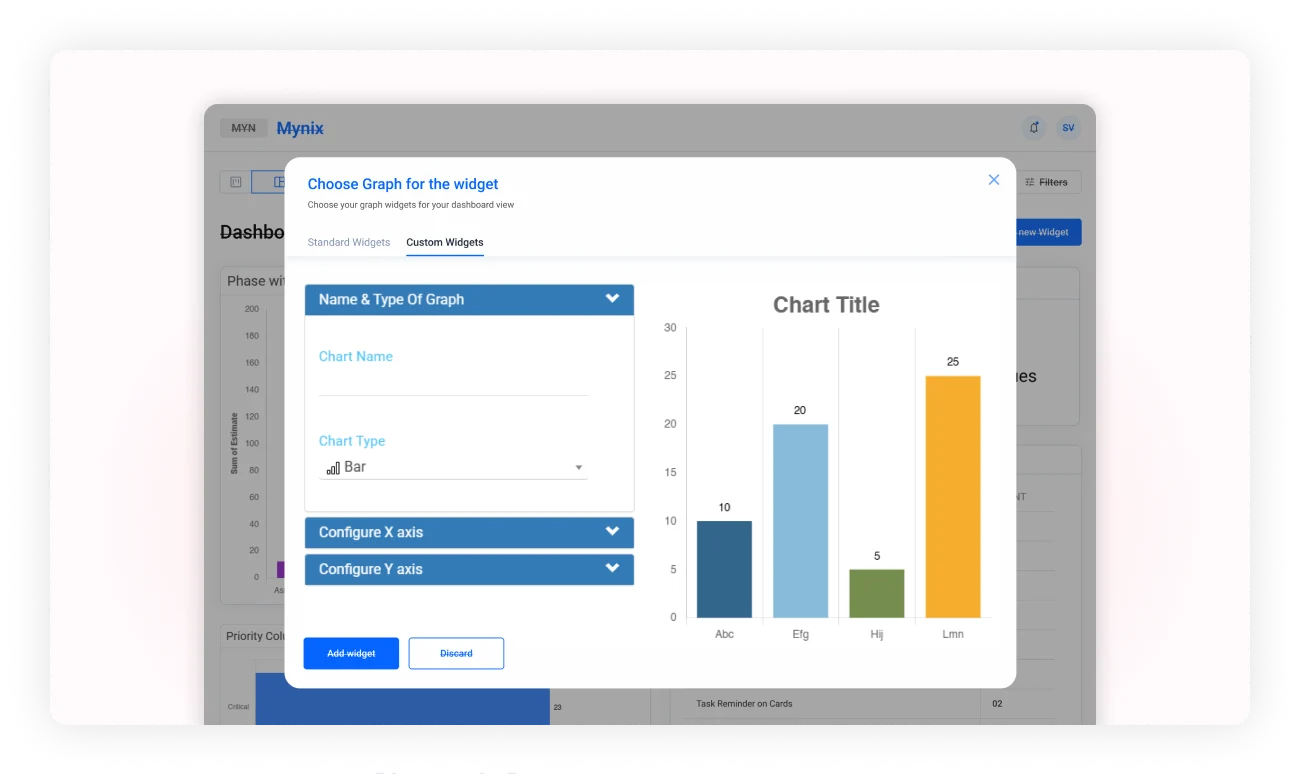
Create personalized analytics for the questions your business actually needs to answer. Choose the data, define the analysis, select the visualization, and control how the result appears on your dashboard.
Build around your questions
Standard widgets answer common business questions. Custom Widgets go further: choose your own metrics, KPIs, workflows, and reporting requirements through a visual interface.
Point, click, configure, and publish without programming or technical dashboard development.
Use workflow fields, custom data, and calculated values.
Apply aggregation, grouping, filters, and time-based logic.
Match the display to the question and the shape of the data.
Set labels, colors, sizing, layout, and display options.
Build a widget in four steps
Creating a custom widget follows a simple visual process that anyone can complete without technical knowledge.
Select workflow fields or calculations that contain the information you want to analyze.
Choose the chart or display type that makes your data easiest to understand.
Define aggregations, filters, grouping, and other display preferences.
Adjust colors, labels, sizing, and layout to fit your dashboard.
The builder in context
The Widget Builder keeps data selection, visualization, configuration, and styling in one visual workflow. The result is a metric shaped for the people who need to use it.
Choose the right visual
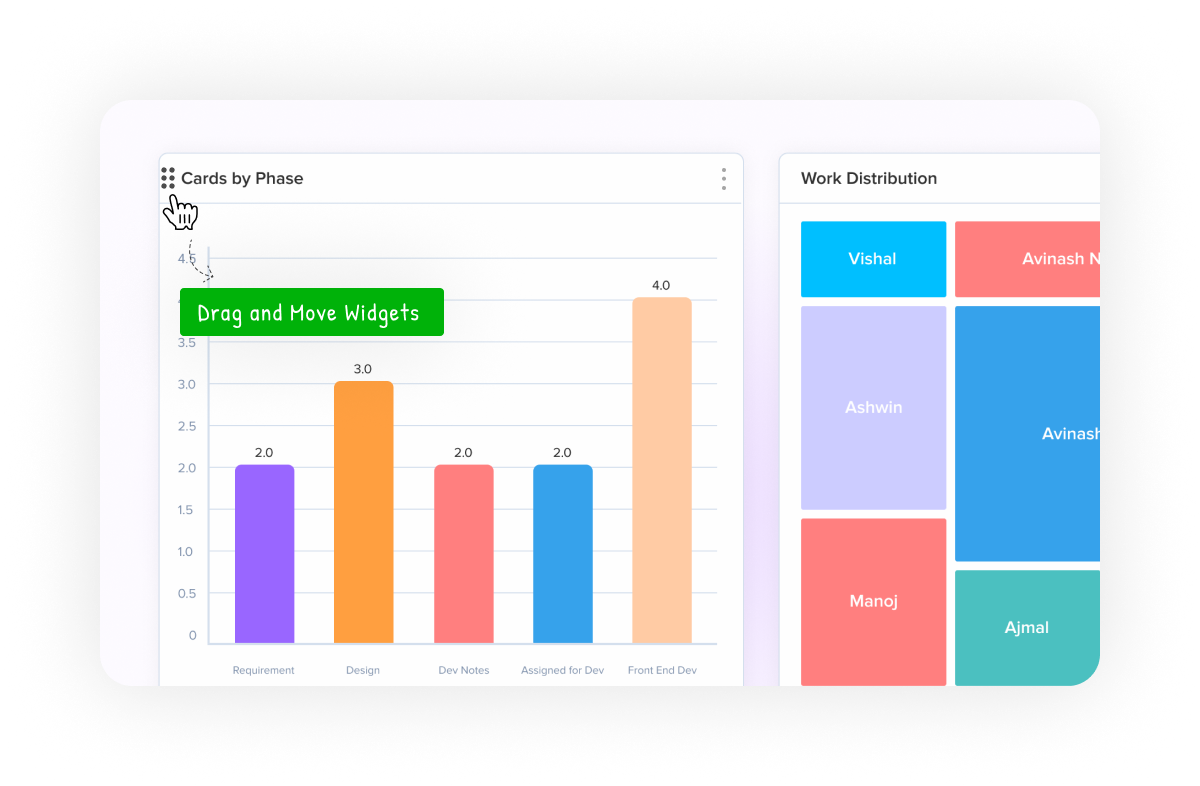
Different questions need different visual forms. Choose the display that helps the reader compare, follow, distribute, or focus on the number.
Six widget types
Data, calculations, and segmentation
Custom Widgets can combine standard fields, custom fields, mathematical operations, dates, and business filters into a focused analytical view.
Access status, assignee, due date, priority, custom fields, and calculated values.
Use count, sum, average, median, minimum, maximum, or percentage calculations.
Group by category, day, week, month, assignee, department, or another useful field.
Keep the widget focused on records relevant to the team, process, or decision.
Make the result readable
Customize titles, labels, axis names, colors, sizing, legends, gridlines, and data values so the answer is clear at a glance.
Choose a preset palette or create a visual language that fits your dashboard.
Name widgets and axes so the meaning is clear without explanation.
Adjust dimensions and internal layout to fit the dashboard composition.
Show or hide legends, gridlines, values, and other visualization elements.
Built for specialized analytics
Build custom KPIs for revenue, conversion rates, territory performance, and pipeline movement.
Track hiring funnels, employee satisfaction, retention, and workforce trends.
Measure quality, efficiency, approvals, budget variance, expenses, and financial performance.
Understand campaign ROI, lead generation, satisfaction, resolution time, and queue performance.
Choose any relevant workflow data, apply your analysis, and turn it into a focused insight built specifically for your business.