Choose the fields you need
Select fields from any phase and add them directly to your table.
Detailed project information
See the fields that matter, right where you need them. Bring custom phase fields directly into Table View and get a clearer picture of your project without opening every issue. Choose the information you need, arrange your view around it, and compare data across records at a glance.
See more of your project
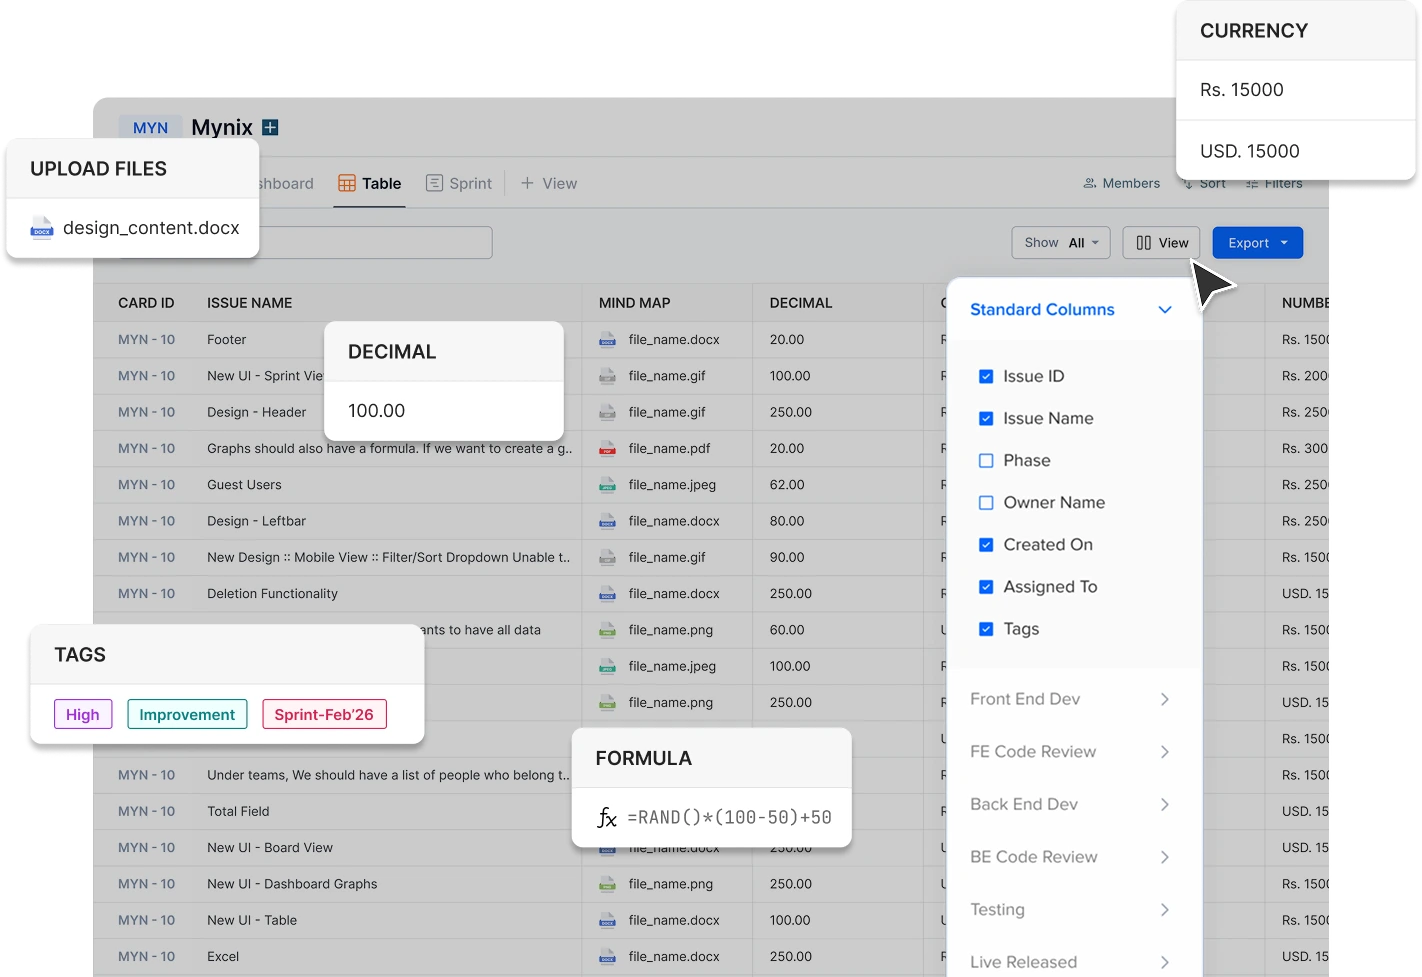
Different phases collect different information. Custom Fields in Table View lets you bring those fields together so your team can see the details that matter without moving between individual issues.
Select fields from any phase and add them directly to your table.
View custom values alongside standard issue information without opening individual records.
Review values side by side to spot differences, trends, and information that needs attention.
Choose from any phase
Your workflow doesn't keep all its information in one place. With phase-organised fields, you can bring relevant data from different stages into the same view.
Browse fields through your workflow phases and select the information you want to display.
Bring fields from different stages together in one table, from early inputs to later outcomes.
Show only the fields your team needs for the task or review at hand.
Work with the data, not around it
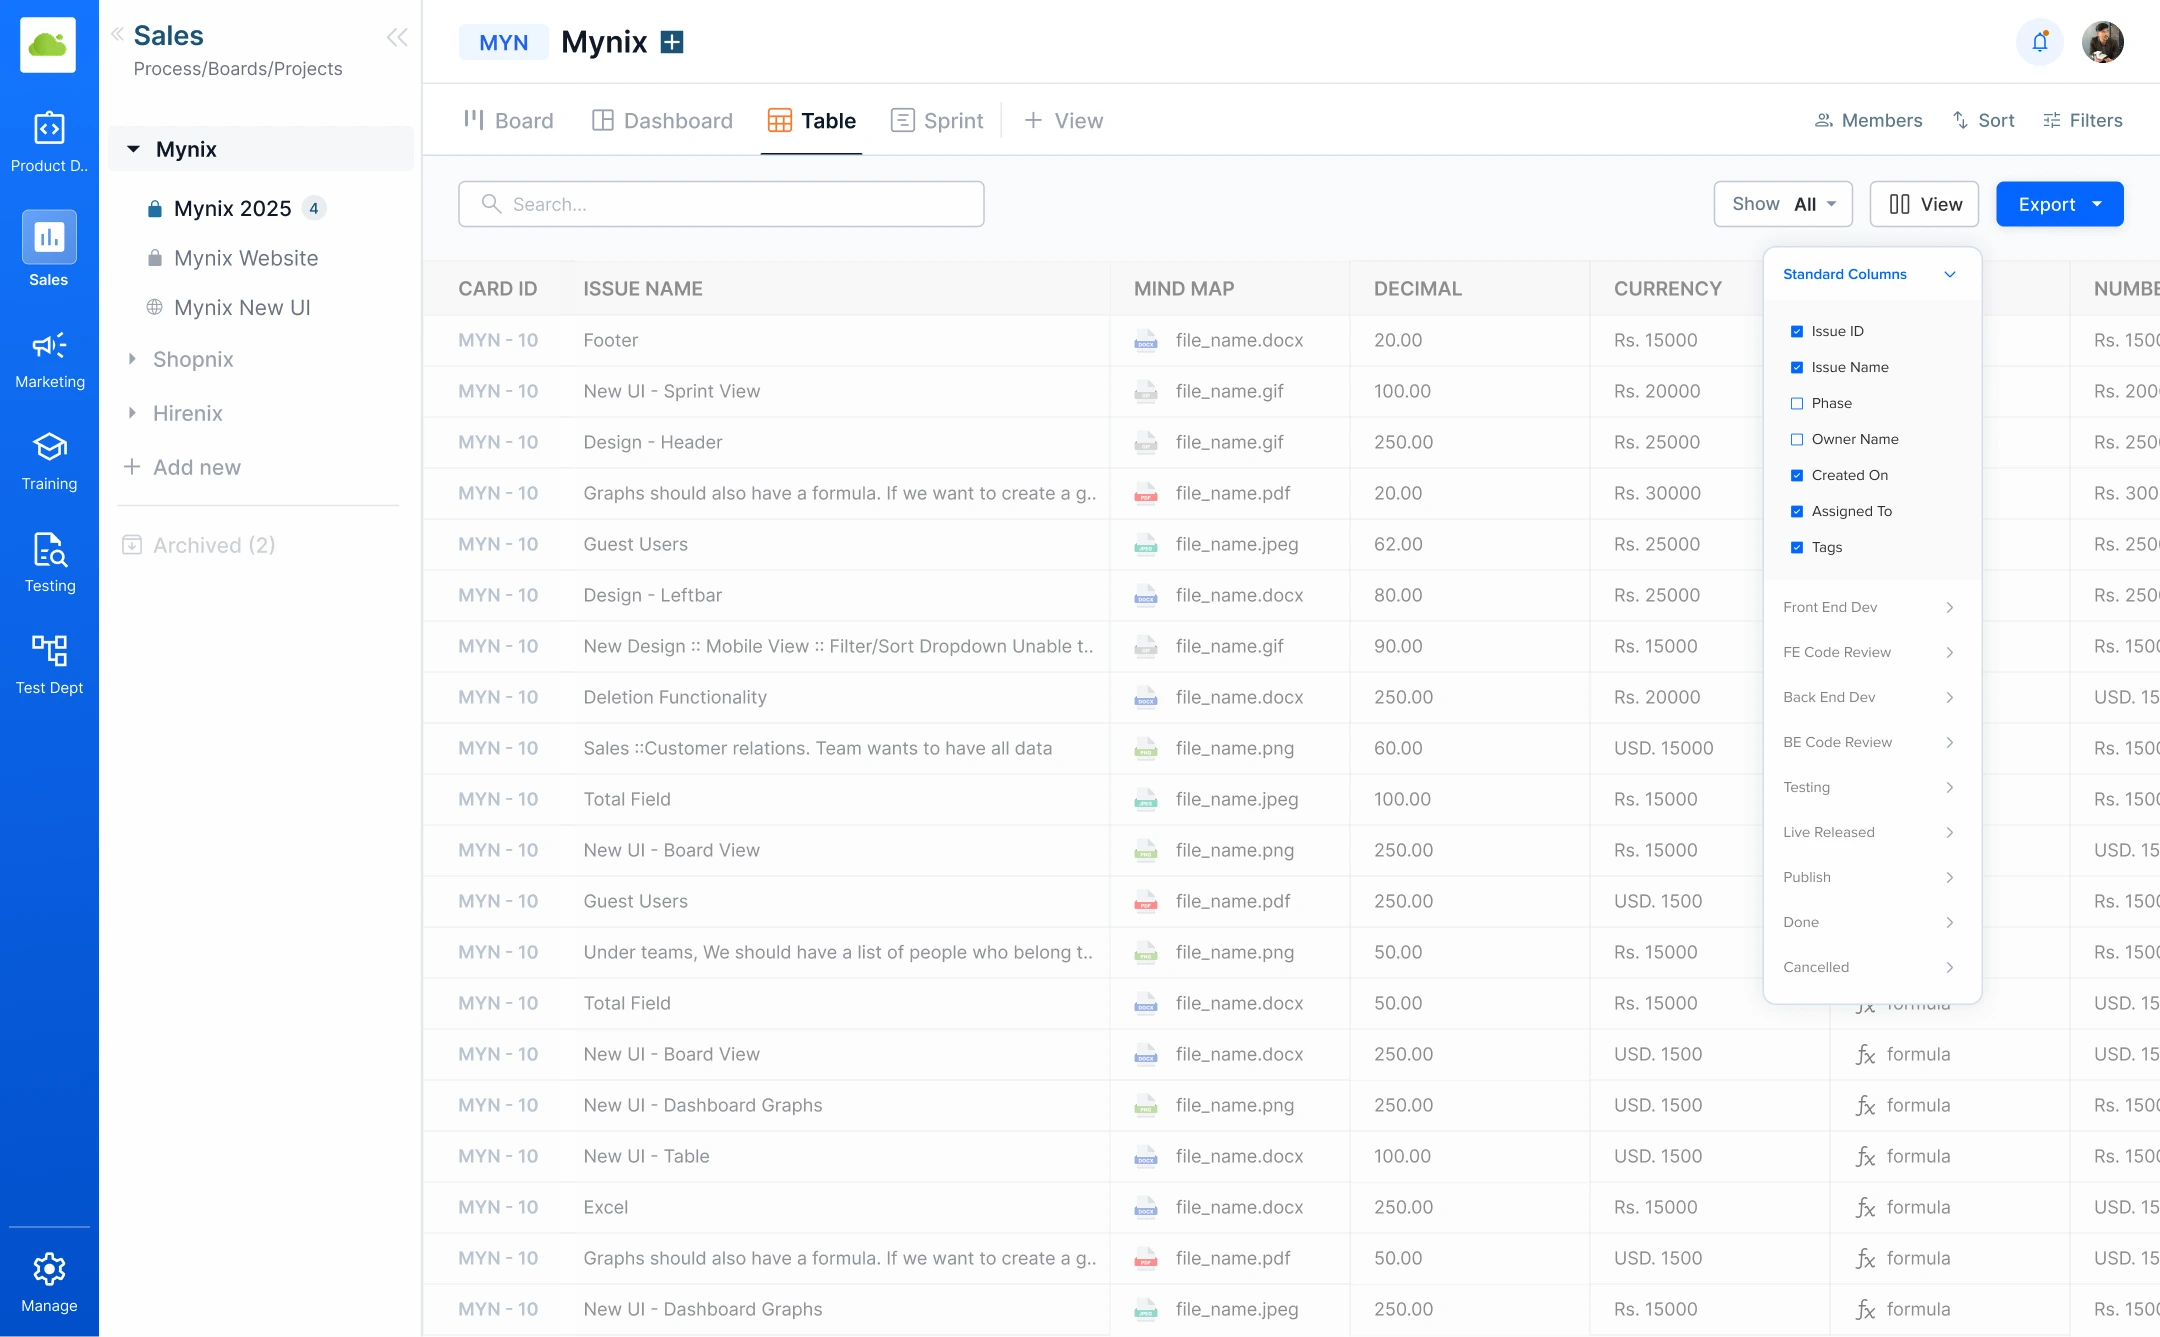
Whether it's a budget, deadline, tag, formula, attachment, or another custom value, the information your team needs can stay visible in the table.
Issue details such as ID, name, phase, owner, dates, assignee, and tags.
Bring text, numbers, decimals, currency, formulas, tags, files, and other custom information into your table.
Surface information collected at different points in your workflow and review it together.
Made for detailed project work
Custom Fields in Table View makes detailed project data easier to review, compare, and manage.
See important project details across issues without opening each card individually.
Bring phase-specific information into one place to make recurring work easier to monitor.
Review numbers, currencies, formulas, and other custom data side by side.
See inputs, progress, and outcomes together in a single structured view.
Your data. Your table.
Choose the fields that matter to your team and turn a standard table into a view built around the way your projects actually work.
Start with the project records you need to review.
Browse fields collected at each workflow stage.
Add the values that matter to your table.
Review the complete picture without opening every issue.
Bring custom phase fields into Table View and give every team a clearer picture of the project.